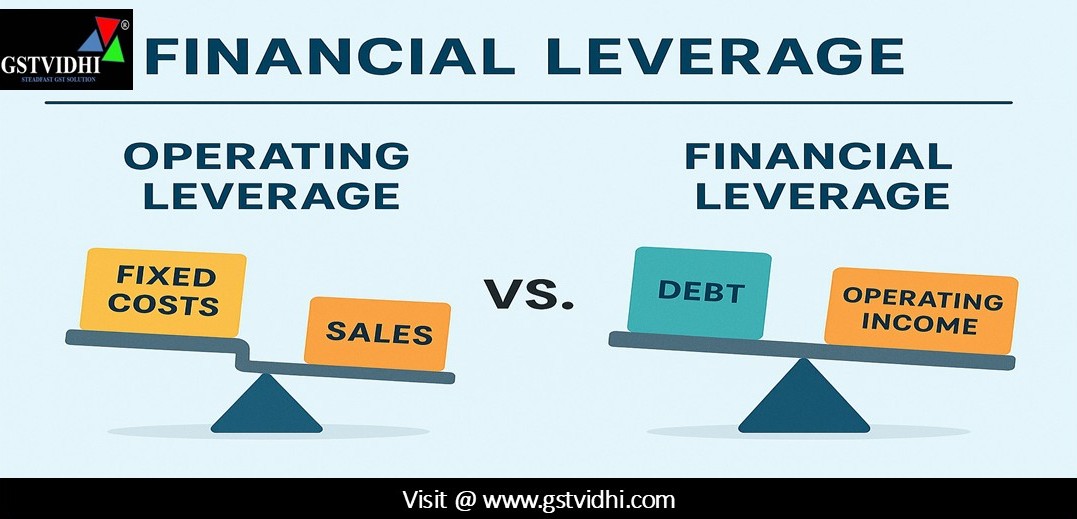
What Is Financial Leverage / How To Calculate Financial Leverage
/ Difference Between Operating Leverage Or Financial Leverage
Meaning
Financial leverage refers
to the use of fixed financial costs (such as interest on debt or
preference dividends) to magnify the effect of changes in EBIT (Earnings
Before Interest and Tax) on the Earnings Per Share (EPS) available
to equity shareholders.
In other words, it is the
firm's capacity to use borrowed funds or preference capital (with fixed
charges) to enhance returns for equity holders.
Definition
“Financial leverage is
the ability of a firm to use fixed financial charges to magnify the effects of
changes in EBIT on EPS.” – Gitman
This concept is also
known as Trading on Equity, which involves using long-term debt and
preference capital along with equity to maximize shareholders’ returns.
Types of
Financial Leverage
1. Favourable
Financial Leverage (Positive): Occurs when the return
on assets acquired with borrowed funds is greater than the cost
of funds.
2. Unfavourable
Financial Leverage (Negative): Occurs when the cost
of funds exceeds the return generated by those funds.

Example 1:
Basic Calculation of Financial Leverage
Capital Structure
|
Particulars
|
Amount
(`)
|
|
Equity
Share Capital
|
1,00,000
|
|
10%
Preference Share Capital
|
1,00,000
|
|
8%
Debentures
|
1,25,000
|
|
EBIT
|
50,000
|
Tax Rate
= 50%
Solution: Profit
Statement
|
Particulars
|
Amount
(`)
|
|
EBIT
|
50,000
|
|
Less:
Interest on Debentures (8% of 1,25,000)
|
10,000
|
|
EBT
(Profit Before Tax)
|
40,000
|
|
Less:
Tax (50% of 40,000)
|
20,000
|
|
Net
Profit
|
20,000
|
Financial Leverage
50,000 / 40,000 = 1.25
Uses of
Financial Leverage
- Measures sensitivity of EPS to
changes in EBIT.
- Helps assess risk in capital
structure.
- Aids in decision-making for using
debt vs equity.
- Identifies the impact of fixed
financial costs on profitability.
Example 2:
Impact of Financial Plans on EPS
XYZ Ltd.
needs `50,000. Two plans are considered:
|
Particulars
|
Plan
A
|
Plan
B
|
|
Debentures
@10%
|
40,000
|
10,000
|
|
Equity
Share Capital
|
10,000
|
40,000
|
|
No.
of Equity Shares (₹10 each)
|
1,000
|
4,000
|
Case 1: EBIT = ₹5,000
|
Particulars
|
Plan
A
|
Plan
B
|
|
EBIT
|
5,000
|
5,000
|
|
Less:
Interest
|
4,000
|
1,000
|
|
EBT
|
1,000
|
4,000
|
|
Less:
Tax @ 50%
|
500
|
2,000
|
|
Earnings
to Equity
|
500
|
2,000
|
|
No.
of Shares
|
1,000
|
4,000
|
|
EPS
|
0.50
|
0.50
|
Case 2: EBIT = ₹12,500
|
Particulars
|
Plan
A
|
Plan
B
|
|
EBIT
|
12,500
|
12,500
|
|
Less:
Interest
|
4,000
|
1,000
|
|
EBT
|
8,500
|
11,500
|
|
Less:
Tax @ 50%
|
4,250
|
5,750
|
|
Earnings
to Equity
|
4,250
|
5,750
|
|
No.
of Shares
|
1,000
|
4,000
|
|
EPS
|
4.25
|
1.44
|
Observation:
Plan A shows higher EPS at higher EBIT due to higher leverage, but carries more
risk if EBIT is low.
Difference
between Operating Leverage and Financial Leverage
|
Basis
|
Operating
Leverage
|
Financial
Leverage
|
|
Activity
|
Investment
activity
|
Financing
activity
|
|
Cost
Involved
|
Fixed
Operating Costs
|
Fixed
Financial Costs (Interest, Preference Dividend)
|
|
Impact
|
Sales
to EBIT
|
EBIT
to EPS
|
|
Formula
|
%
Change in EBIT / % Change in Sales
|
%
Change in EPS / % Change in EBIT
|
|
Trading
on Equity
|
Not
possible
|
Possible
|
|
Dependency
|
Fixed
& Variable Cost Structure
|
Operating
Profits
|
|
Tax/Interest
Impact
|
Not
affected
|
Affected
by Tax and Interest Rates
|
Key
Concepts
Financial Break-Even
Point
The level of EBIT at
which a firm just covers its fixed financial costs, i.e., EPS = 0.
Indifference Point
The EBIT level at which two
financing plans yield the same EPS. Beyond this point, the more leveraged
plan gives higher EPS.
Disclaimer: All the Information is strictly for educational purposes and on the basis of our best understanding of laws & not binding on anyone.
Click here